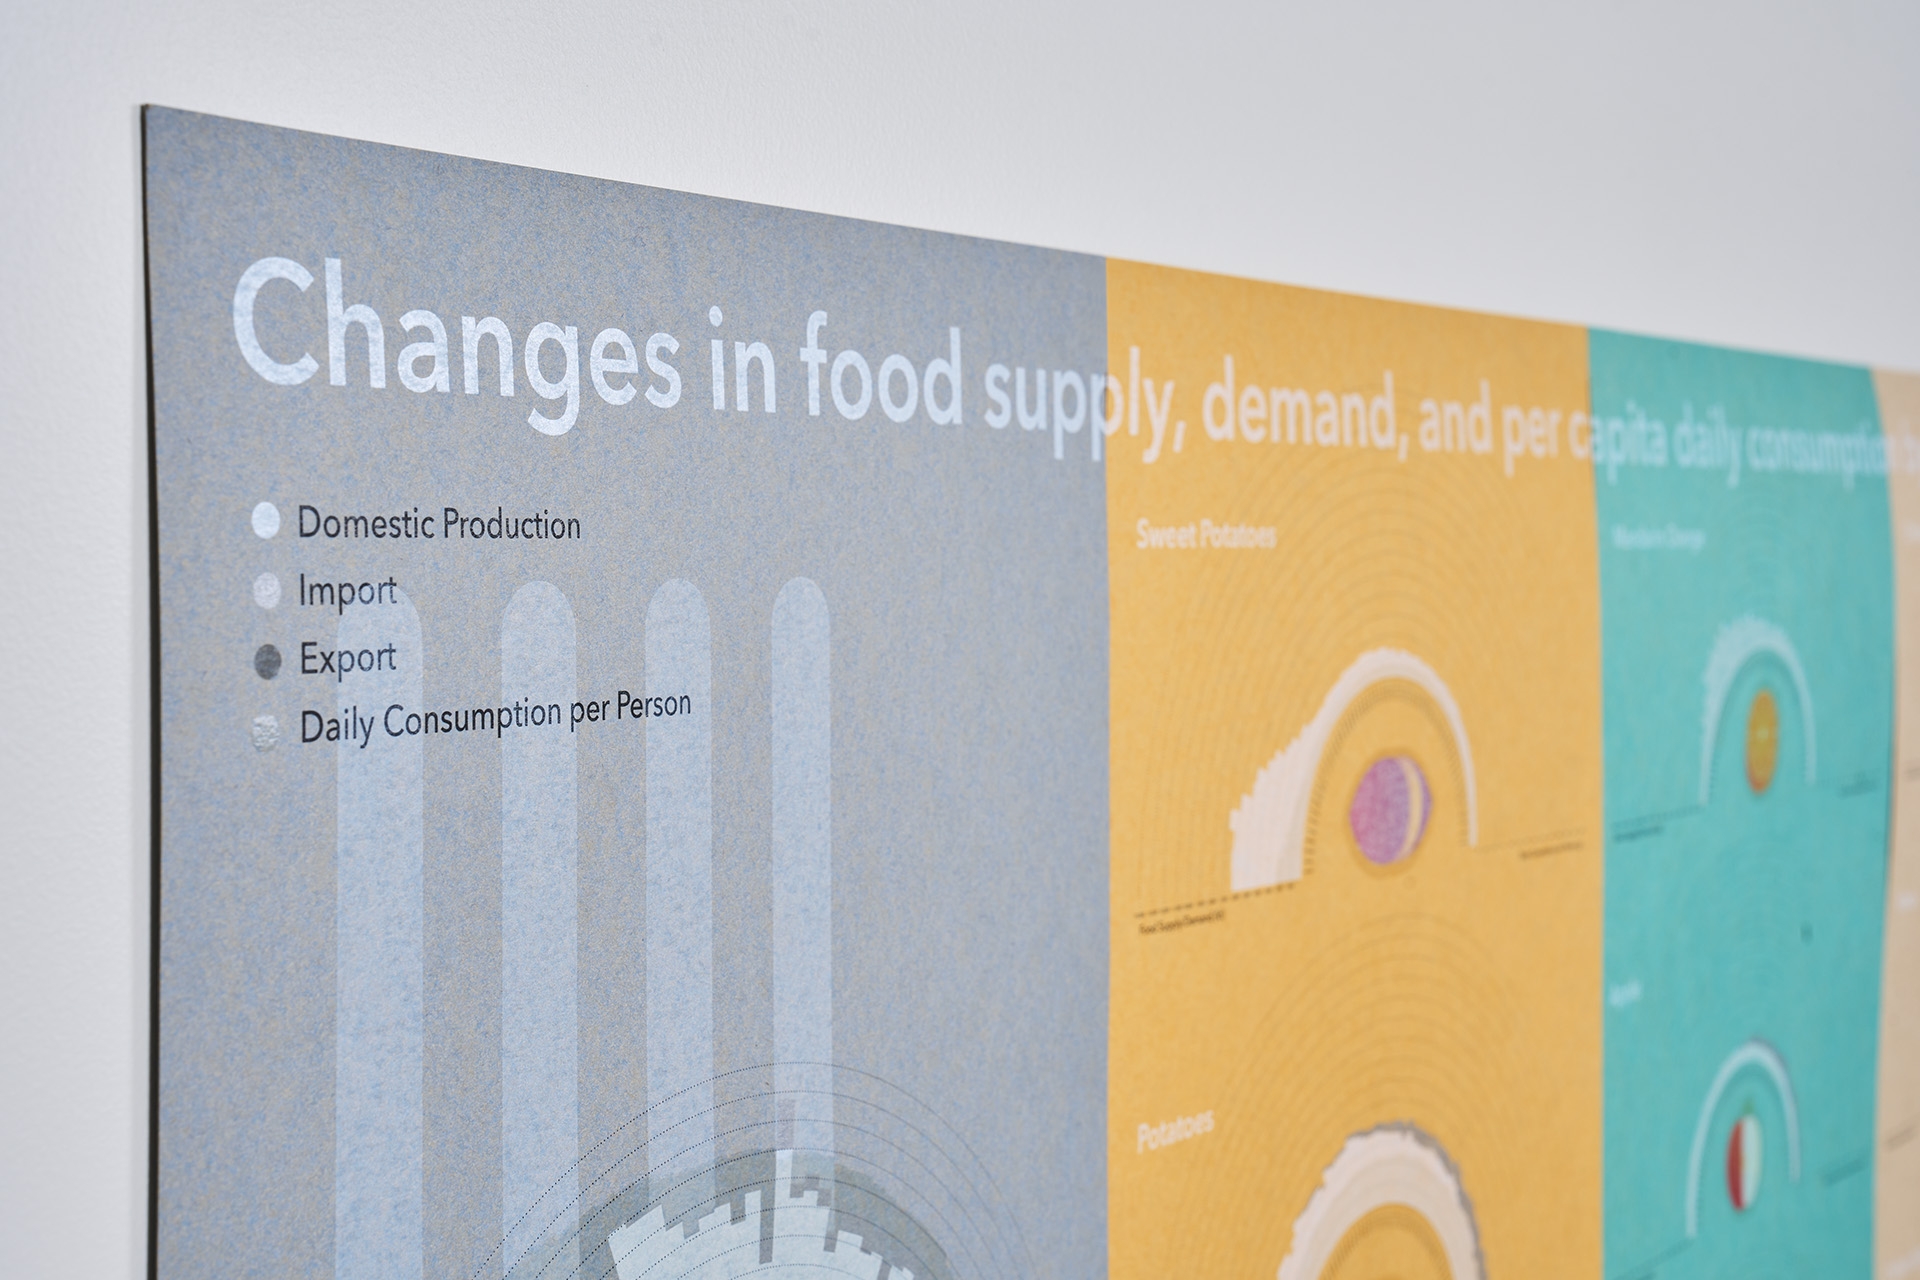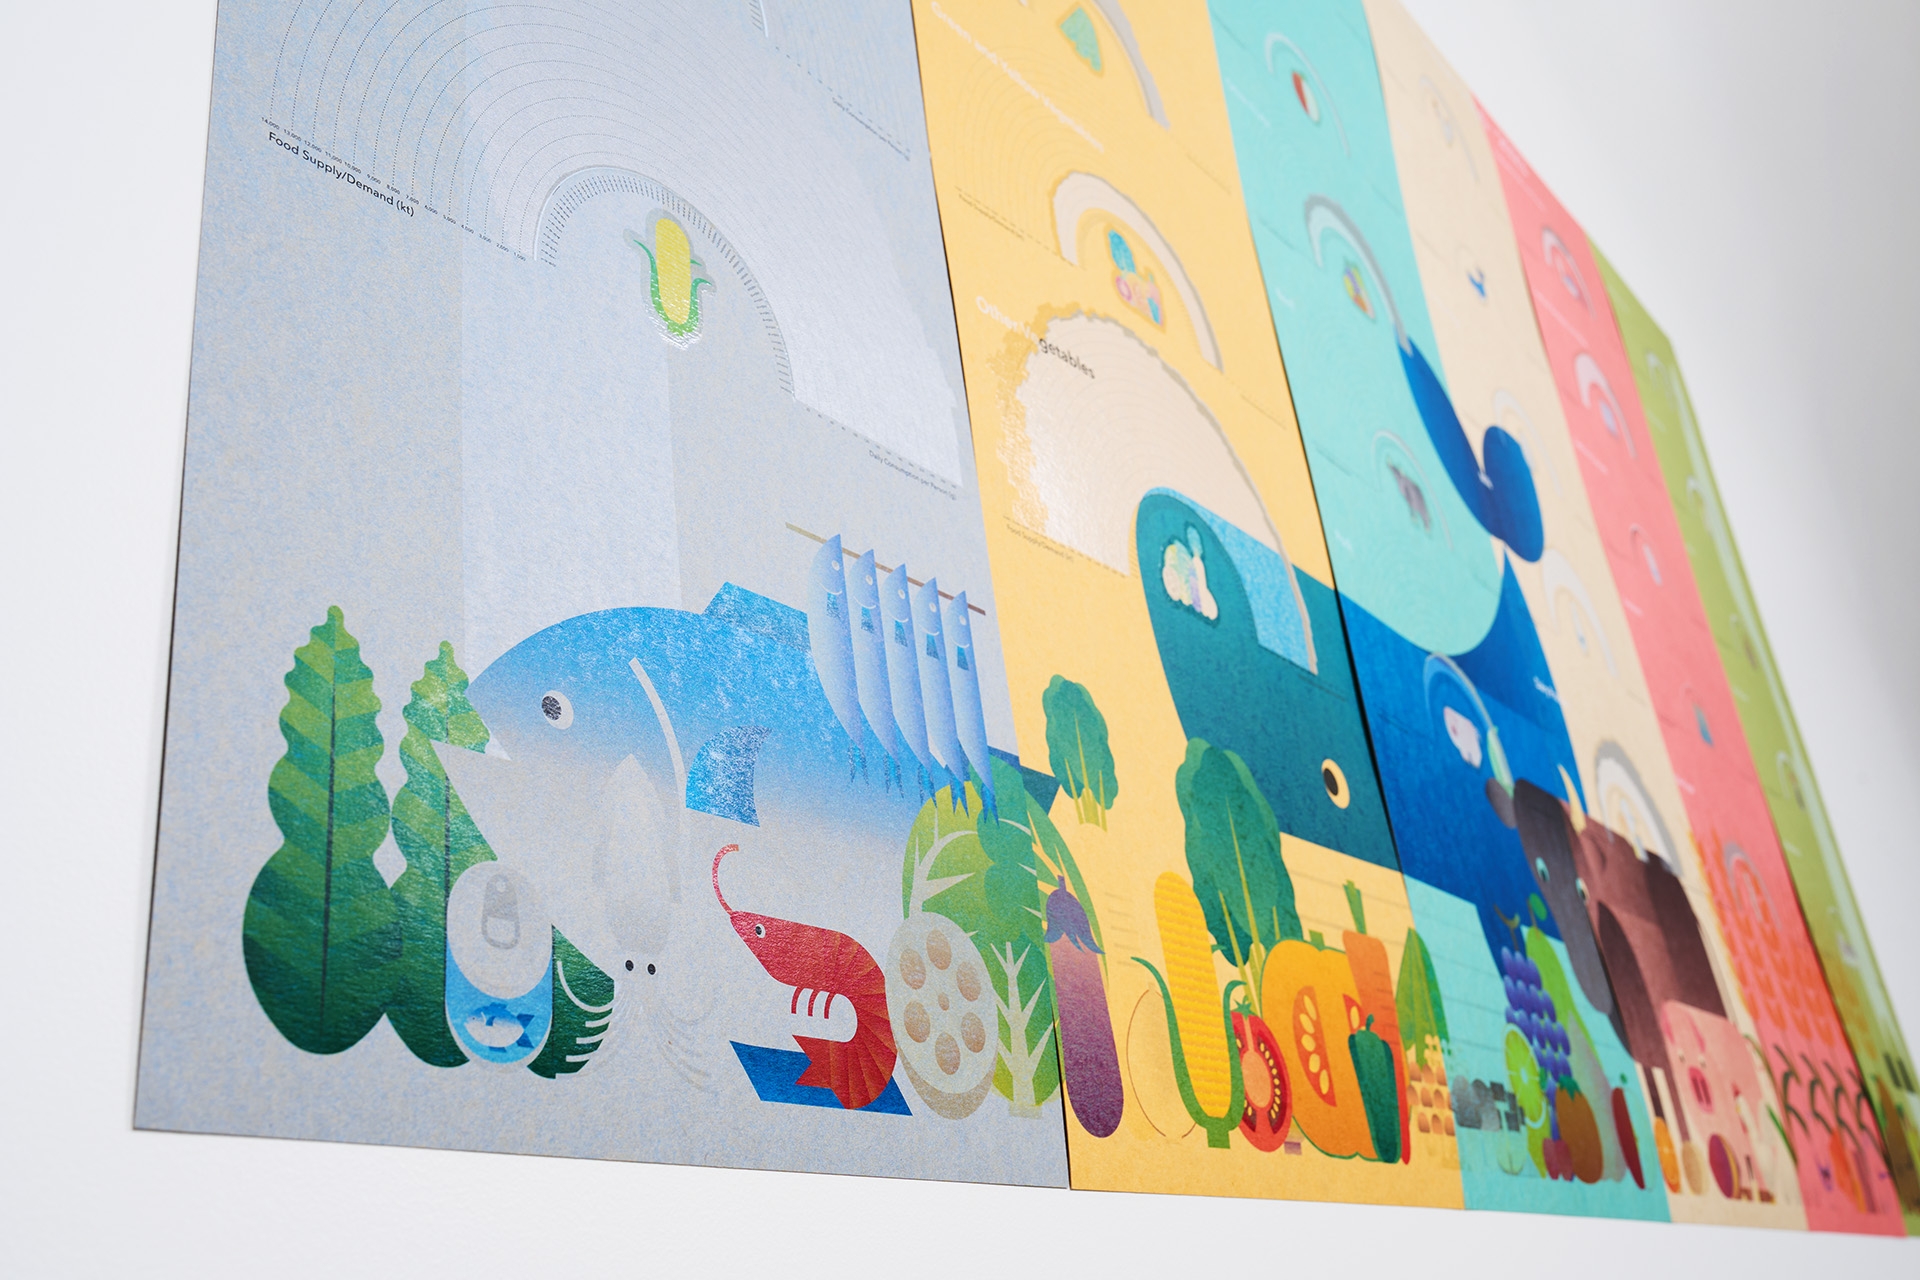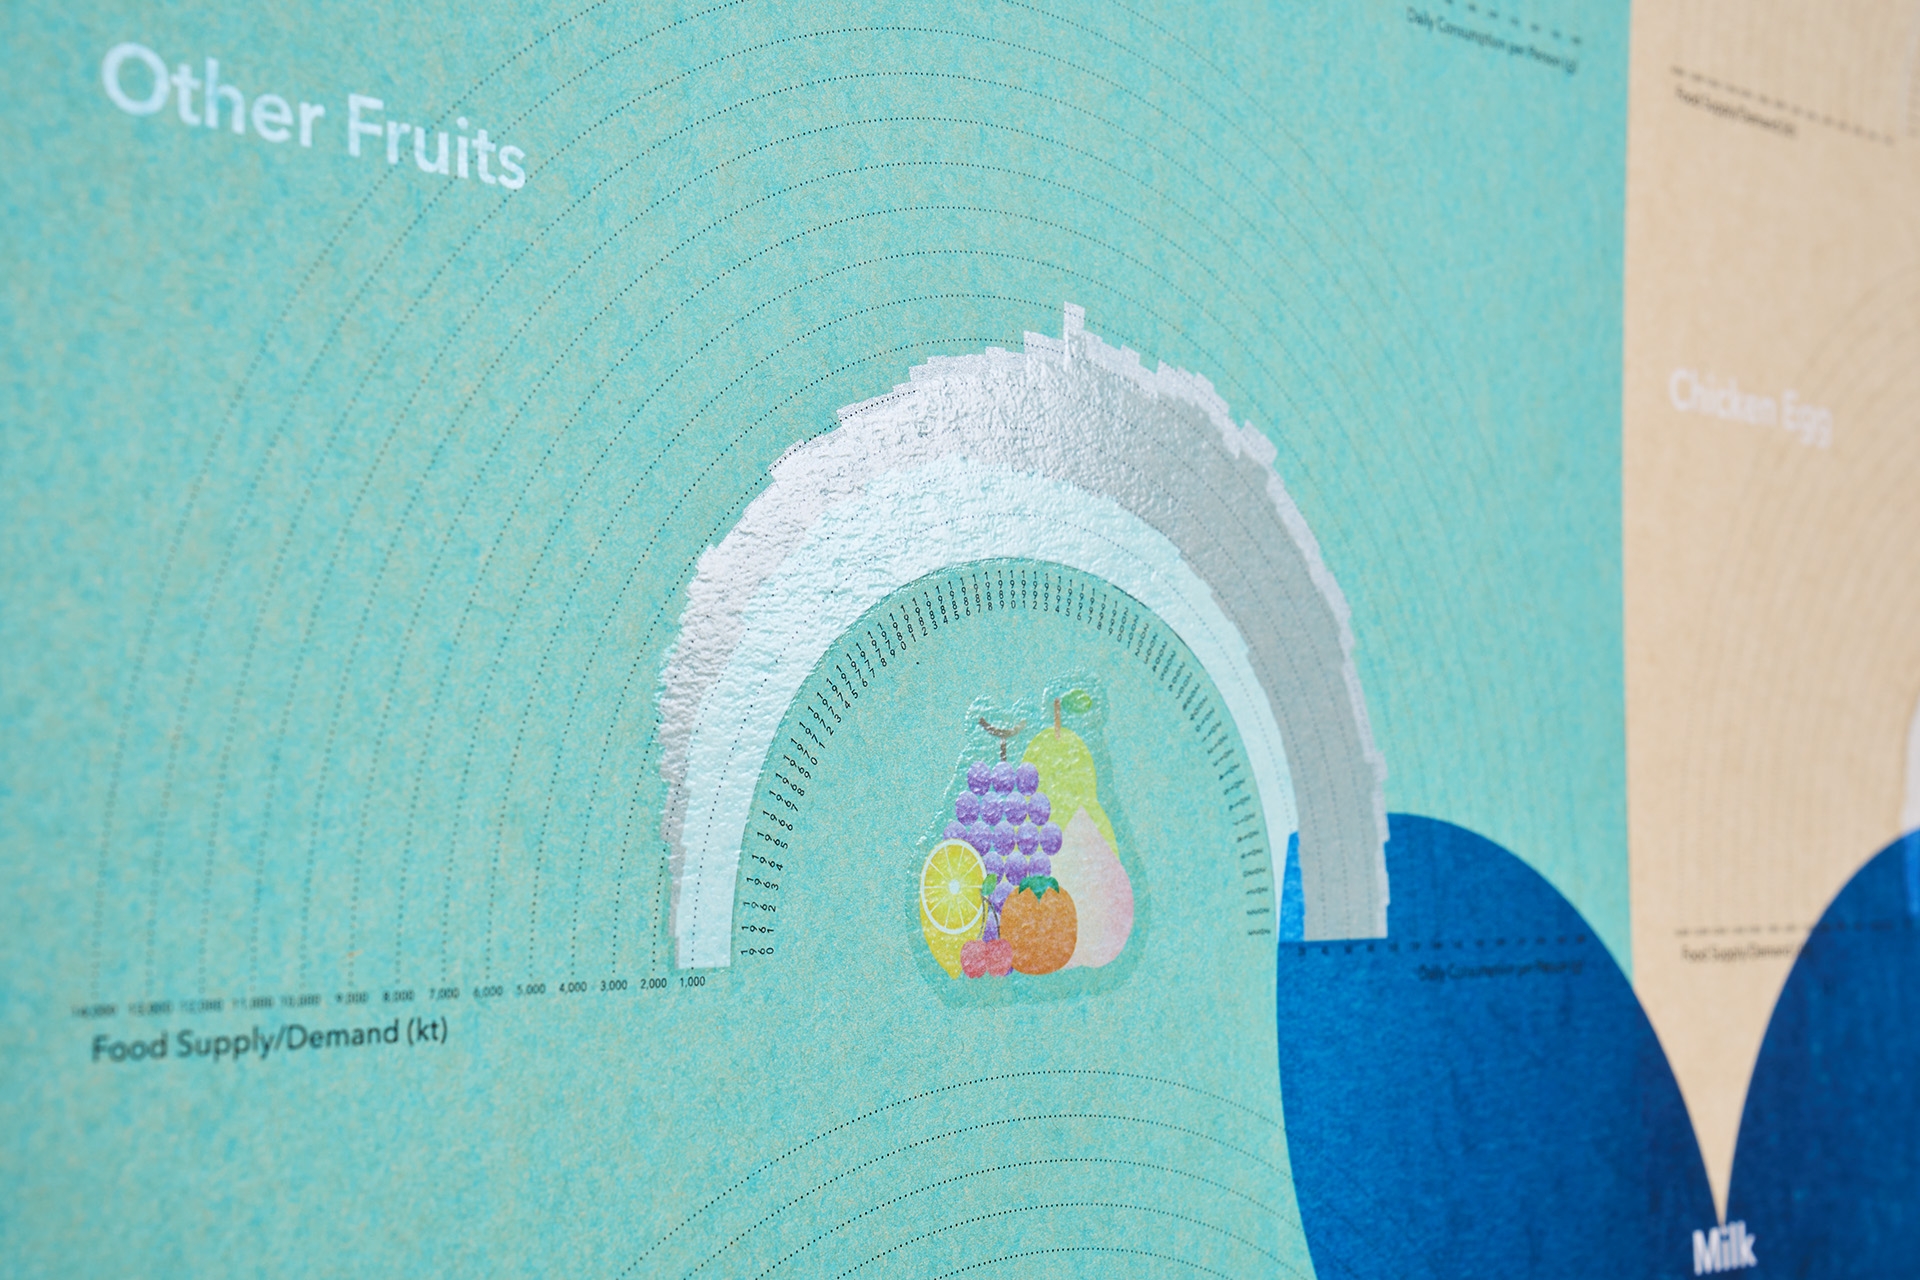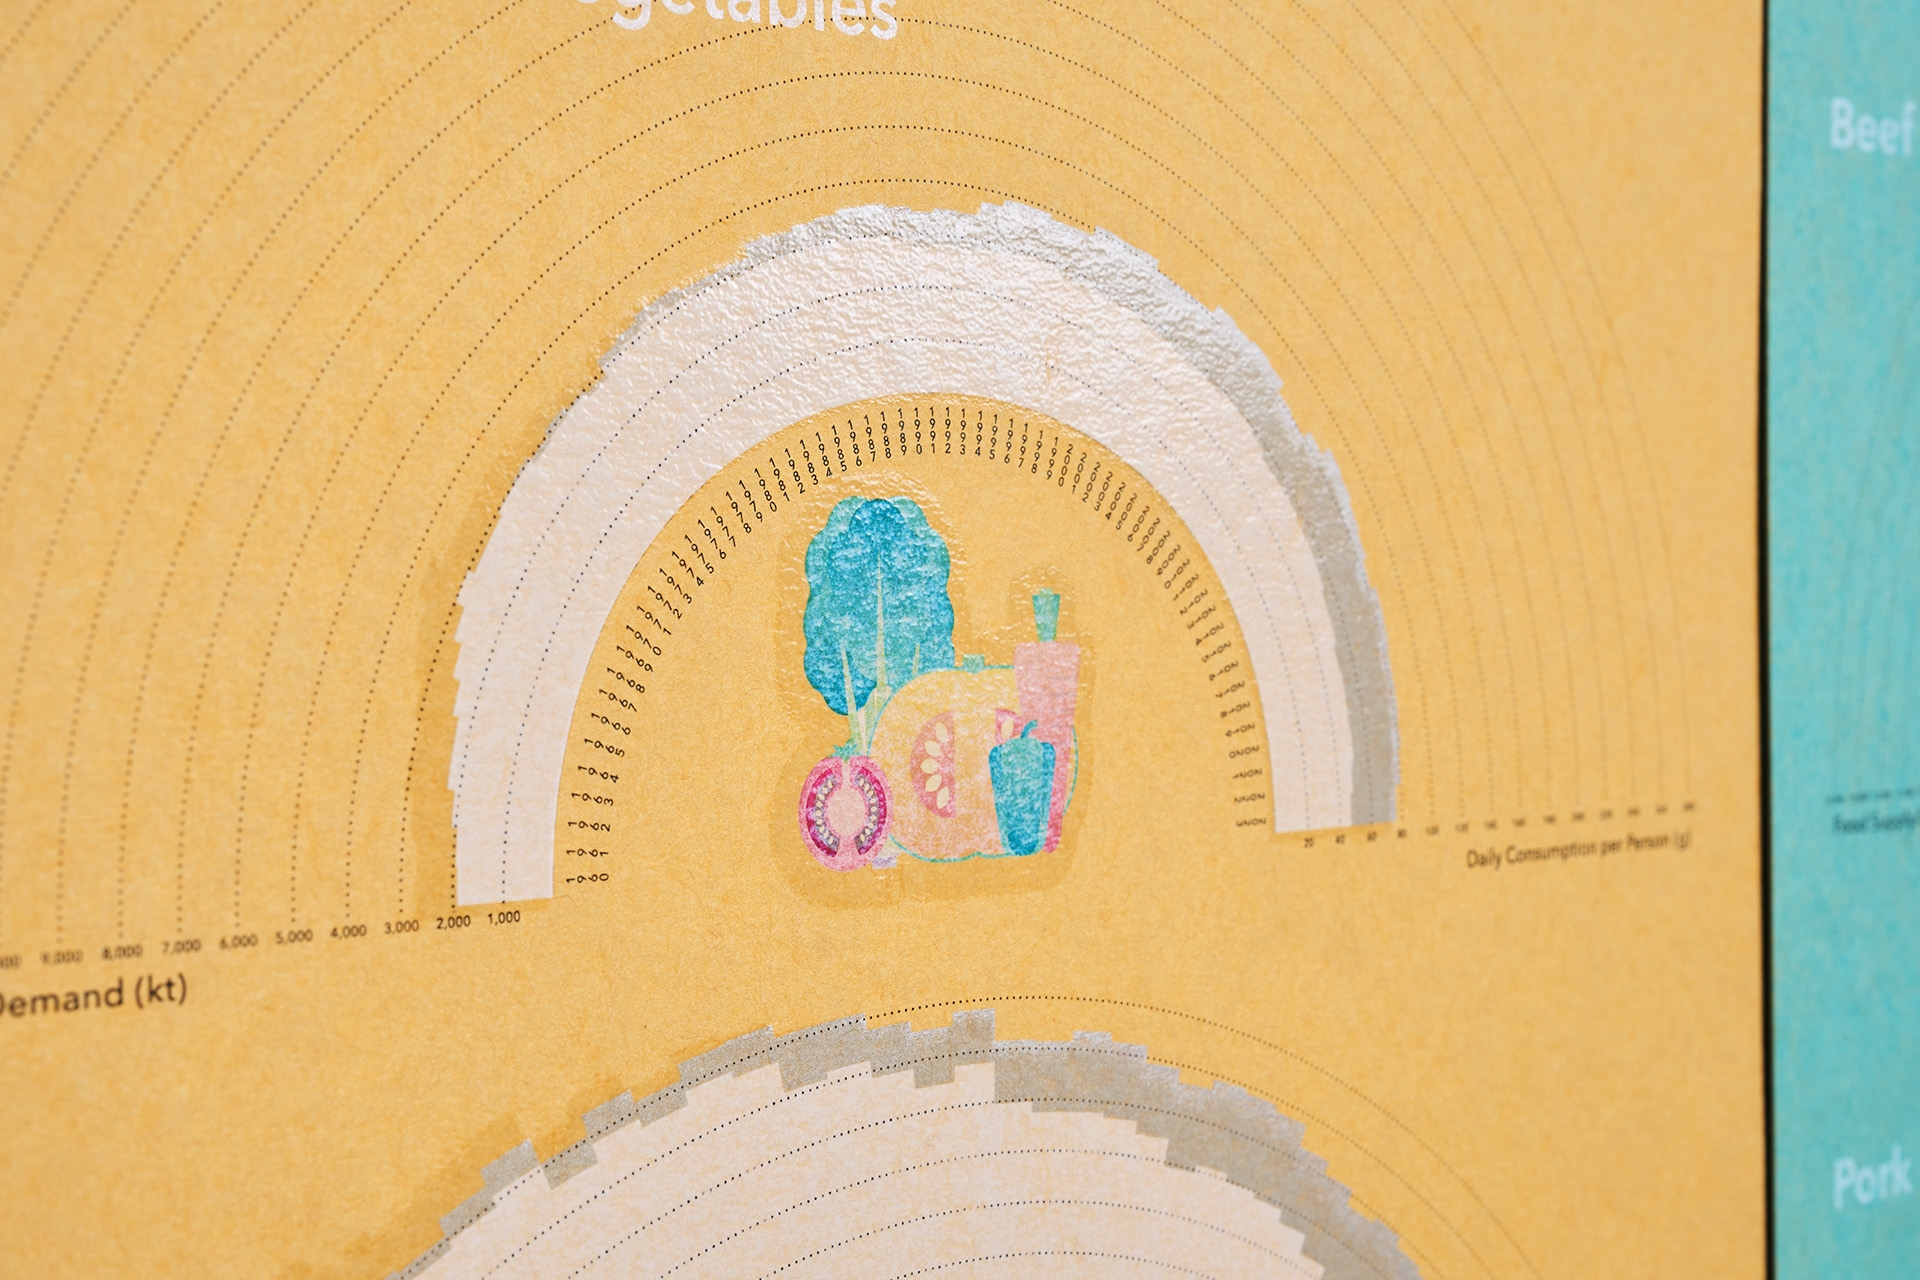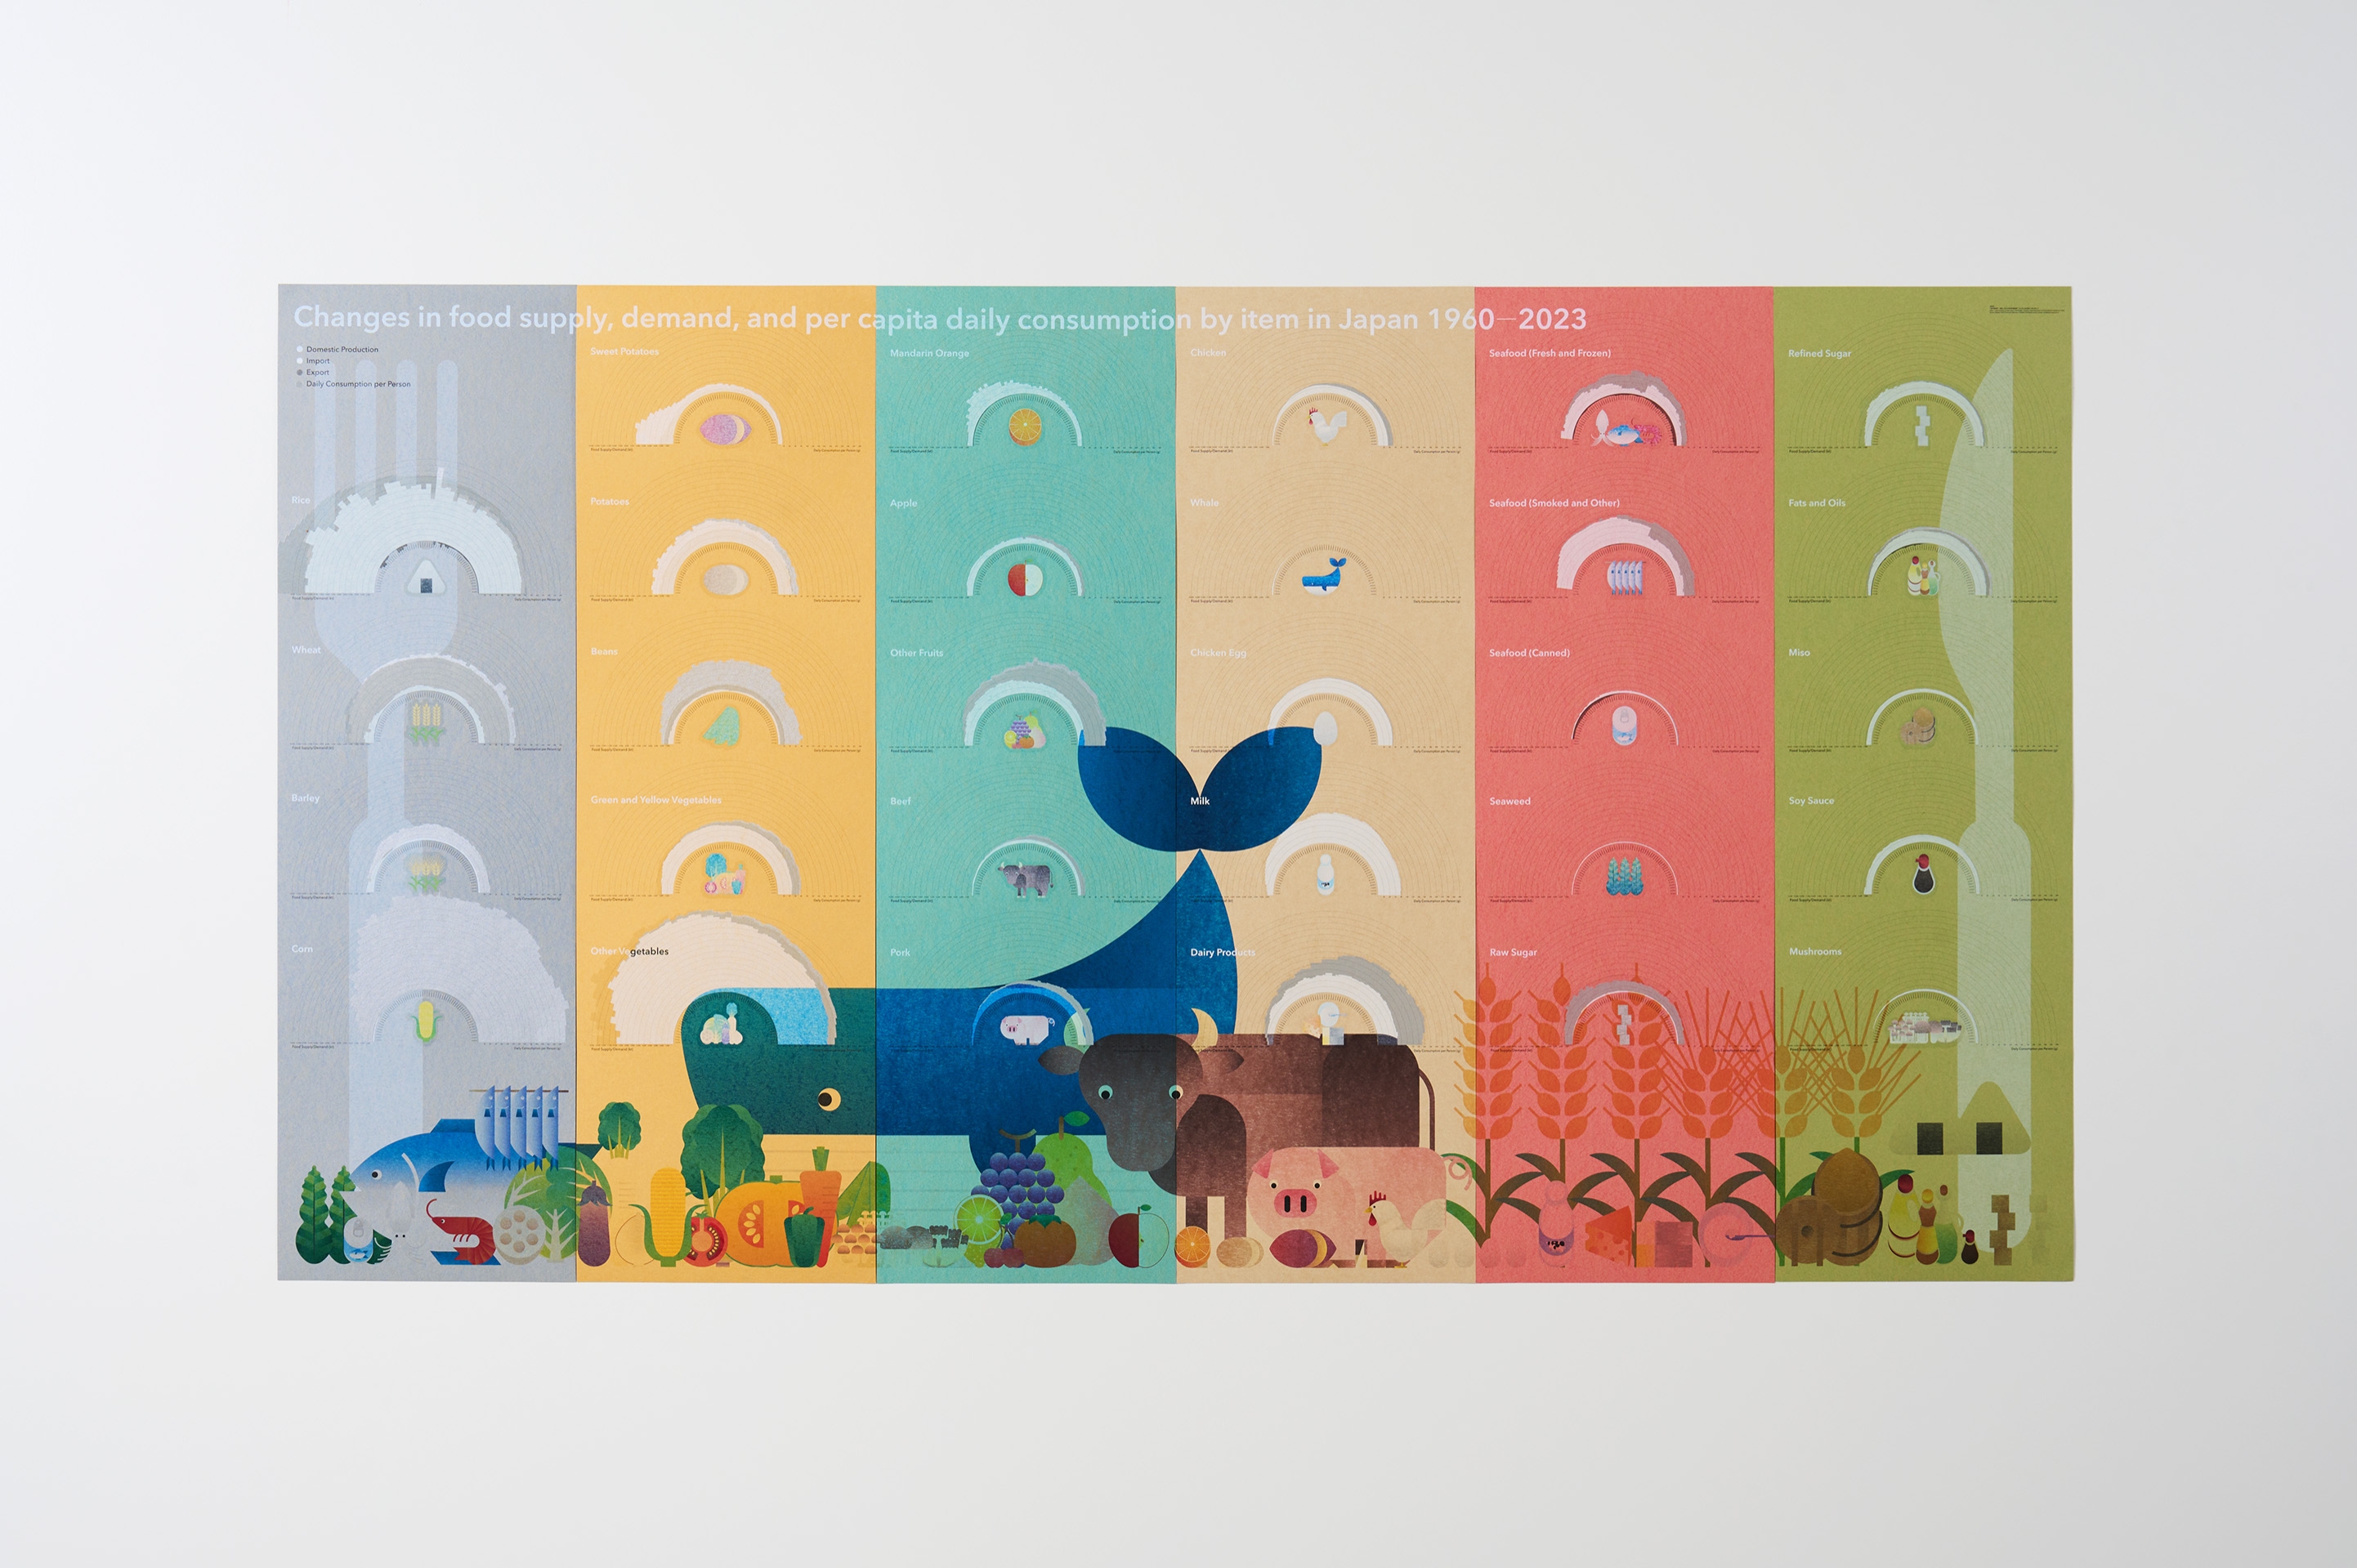
This diagram depicts Japan's domestic production, import, and export volumes of food, as well as the daily food supply per capita, for major items such as rice, wheat, beef, and fish from 1960 to 2023. By visualizing the trends in each food group produced and consumed in Japan, it will hopefully provide an opportunity to reflect on how dietary habits have changed over time. It is made using six different types of paper, with four colors printed over white ink, then silver ink over that, and finally clear ink applied 10 times.